
VILCARDIS
Construction Manual for a Tactile 3D Grid:
Coordinates and Relative Dimension in Space (CARDIS)
version 1.0, November 21, 2018
Kathy DeGioia Eastwood (Northern Arizona University) and Wanda Diaz-Merced (OAD)
Motivation
For blind and visually impaired (VI) students, some concepts are much more difficult than others. In particular, any concept dealing with three dimensions and changes in coordinates are difficult. We have developed a tactile three-dimensional grid that can be used to address many different perceptual problems; the grid is nicknamed the CARDIS. This document describes the construction of the grid; other resources are available at http://astrosense.astro4dev.org/
Materials
For each grid, appropriate for two students:
- Three pieces of PVC pipe (or half inch in Schedule 40); our pieces were approximately 55 cm long. (See the discussion of pipe length under Dimensions below.)
- We used the equivalent of 20 mm diameter pipe (or half inch in Schedule 40, which is what they sell in the United States). You can also use pipe of a different width; the deciding factor is what fittings you have available.
- A pipe fitting that holds the three pieces of pipe together at right angles, forming the xyz axes. This can be difficult to locate. In some countries it is available for plumbing or irrigation and may be called a side inlet valve. In some countries it is also made for constructing furniture of PVC pipe. If you order a fitting made for plumbing, make sure that you get one intended for a friction fit rather than a threaded fit. If you cannot find it anywhere but are willing to wait for 60 days, they are easily available on http://www.aliexpress.com/; search for “PVC fittings”.
- Foam mats that are easily cut with scissors. These are typically sold for children to play on, and can be called “EVA puzzle mats” or just “floor mats”. Any other kind of foam surface area can be substituted as long as it is not brittle; the goal is to have the layer of foam be the same height as the pipes used for the xy plane. We glued two layers of foam together to achieve this goal.
- Cord of very different textures. We used surveyors’ cord in a bright color from the hardware store for our first texture, and a highly textured “glittering” elastic cord from a craft store. If you can’t find two very distinctive textures, you can use hot glue for the second texture.
- Different types of glue. Not all glues work with all materials. The glue we ended up using the most was the white craft glue, which dries slowly but does not work well with plastic. The glue that worked the best when plastic was involved was the clear adhesive that dries quickly, but the fumes are not safe and we found that we needed to use it outside. For one of our models, we used a hot glue gun to put down a very nice three-dimensional bead rather than using cord; the disadvantage was that it was very difficult to keep the bead nice and smooth, so there were a lot of blobs.
- Velcro, the self-stick type, to keep the foam mat lined up with the tickmarks. We recommend not getting the extra strength or industrial strength variety. The adhesive did not stick well to the foam mats, and as a result the Velcro would pull off the mat rather than separating. The regular strength is sticky enough for the purpose.
- Foamboard, also sometimes called foam-core. This is a lightweight but stiff medium and can be bought at an art or craft store. You can substitute very stiff cardboard, or even a cakeboard. In the end this wasn’t really sturdy enough, but we haven’t yet found a substitute. Let us know if you come up an idea; the medium needs to be not only lightweight and stiff, but needs to be pinned in order to keep the cord in place.
- Cable ties. These are inexpensive and can typically be bought at a hardware store or at an electronics store. We used two different sizes; a small size to create the tickmarks on the pipes, and a larger size to suspend the vertical plane. If you can’t find cable ties, it is easy to use hot glue to put the tickmarks on the pipes, but you’ll need to find some sort of sturdy substitute to suspend the vertical plane.
- Clear tape, the type used to seal shipping parcels. We used this to reinforce the edges of the foamboard, because otherwise the cable ties tore through the cardboard.
- Fine-tip permanent marker.
- Ball-point pen.
- Blade cutter.
- Scissors.
- Ruler. It is also very helpful to have another long ruler, i.e. a meterstick.
- Map pins work the best. If you can’t find them, push pins will work. Although we show thumb tacks (drawing tacks) below, they do not work as well as the stem is not long enough.
- Protractor (the kind with the angles labeled).
- A large protractor. We constructed one out of paper, see below.
- Braille labeler.
Dimensions
We cannot say what the ideal size is for your CARDIS, but we can tell you what we learned. Putting the tickmarks 2 cm apart is too small; it is very difficult to knot the string accurately, and the xy grid becomes very confusing. Tickmarks 5 cm apart worked well. We wanted to have each axis of the grid hold at least 10 tickmarks, so that made each axis a little longer than 0.5 m. The only problem we had was moving the CARDIS; the axes come apart easily, and the xy plane made of foam is bendable, but we had a difficult time transporting the vertical plane made of foamboard. It was too large to fit in many suitcases, and came out slightly warped.
Basic structure
To make the basic structure, start by drilling a hole in the pipe fitting. This hole is the mathematical origin of the grid. As shown in the image below, we drilled the hole at the point of symmetry so that the cord coming out of the hole would be equidistant from the three axes. We found it useful to have the hole slightly wider than the cord, so that a single slip knot would pull through with some difficulty.
The R vector will be represented by a knotted cord coming out of the origin. We used surveying cord of a bright color. Knotting the cord precisely is tricky; expect this process to take several tries and to throw away the first couple of cords! Before inserting the cord in the origin hole, knot tickmarks on it. At first we were testing and figuring out exactly how far apart to mark the cord, and then drawing marks on the cord, and then making knots. In the end, however, it worked just as well to eyeball the knots, putting them in one at a time and measuring as we went. Leave at least 5 cm of extra cord at the origin end, and perhaps half a meter at the other end; the extra cord will need to reach down to the xy plane after the R vector is tacked up.
AFTER the tickmarks have been knotted, slip the origin end through the hole, and make a bigger knot on the inside of the fitting as shown. Jiggle it around until the distance between the closest knot and the origin is exactly one tickmark long, and then make the inside knot bigger so it can’t slip.
Above left: Illustration of tickmarks on cord, and cord going through origin hole.
Above right: Illustration of the inside knot which keeps the cord from slipping out through the origin hole.
Right: an example of the knotted cord.
Note on R vector (the knotted cord)
If you are only doing elementary lessons with your CARDIS, i.e. area and volume as opposed to polar and spherical coordinates, you do not need an R vector. You may still want to drill the hole in the pipe fitting so that you have a specific position for the origin.
Creating the xy plane
The next step is to construct the xy plane. After cutting off the edges, we cut our pieces of foam in a wedge shape, although if you aren’t using angles, you could just as well leave it as a square. As described under Materials, the ideal height for the foam is the size of the pipe on the table. We glued together two sheets of foam to get the right thickness.
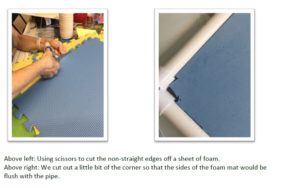
Above left: Using scissors to cut the non-straight edges off a sheet of foam.
Above right: We cut out a little bit of the corner so that the sides of the foam mat would be flush with the pipe. The next step is to position Velcro to hold the xy plane in the right position relative to the tickmarks on the axes. It is important to do the Velcro FIRST before adding the tickmarks; otherwise it will be difficult to get the tickmarks on the axes to line up with the tickmarks on the xy plane. We used small strips of Velcro on the sides x axis and y axis to line up with strips on the edge of the foam mat.
Adding tickmarks to the axes (pipes)
As discussed above under Dimensions, we found tickmarks separated by 5 cm to be a good size. Making them much smaller makes it difficult to get the knots the right distance apart, and increases the percentage uncertainties. Making them much bigger leaves you with too few tickmarks.
Before marking the positions of the tickmarks, attach the foam sheets to the pipes using the Velcro so that they won’t slip. Then use a permanent marker to mark the positions of the tickmarks on the axes (pipes), remembering to measure the distances from the origin (the drilled hole), NOT from the end of the pipe. After marking the positions, it is necessary to add something three-dimensional to the tickmarks so that they are tactile. Our favorite method for making the tickmarks tactile was to use cable ties. Slip the cable tie on, tighten it up a bit, fiddle with the position, and then pull it very tight. Cut off the remaining tail, but as the edges can be sharp, put a drop of glue on the cut edge. One alternative to cable ties is to use hot glue to make the tickmarks, although it can be lumpy. What DOESN’T work is scratching the tickmarks with a razor blade (too flat), or using the clear or craft glue (too flat).
Adding tickmarks to the grid
After you have secured the foam xy plane to the x and y axes and put the tickmarks on the axes, you can add the xy grid to the foam xy plane such that the gridlines line up with the tickmarks. (Trust us: follow this order.) What we did is to use a ruler to draw the gridlines on to the foam with a ballpoint pen, and afterwards glue on cord to make those gridlines three-dimensional. Remember to measure the first gridline from the origin hole, not from the edge of the foam.
We made ours so that we could flip over the foam xy plane and use it on either side. On one side we have only the xy grid, for the more elementary students, and on the flip side we have both the xy grid and the angles, for the more advanced students. We found that it was very difficult to make the angles accurate with a tiny protractor, so we built a large protractor out of paper. We marked the angles on the paper as accurately as we could, and then used a pencil and string to draw the outer curved edge of the quadrant. After cutting the curve, we measured out a piece of string equal to the circumference of the quadrant and used a calculator to divide that into nine segments, and then measured each segment along the curve of the circumference. The edges of the segments lined up nicely with the angles we had measured, and we felt confident about our angles. Above left: Constructing a large paper protractor.
Above right: The final protractor.
Above left: The xy gridlines drawn with ballpoint pen.
Above right: The angles also marked in ballpoint pen.
After drawing the gridlines you can start gluing down cord in order to make both the grid lines and angle lines tactile, but we found it more efficient to make the vertical plane first, with its own gridlines, before putting down any cord. We used clear white glue to put down cord, and typically it took about eight hours to dry completely. Thus we would glue down a set of cords (e.g. all the horizontal lines) on each surface at once, and then come back eight hours later and put another set of cords on each surface.
Making the vertical plane
Making and hanging the vertical plane is the most difficult part of the construction. Note that you may not need the vertical plane if all you want to do with the CARDIS is area and volume for younger learners. The primary purpose of the vertical plane is to hold the R vector in place and to allow students to measure the coordinates of the R vector. We made our vertical plane out of foamboard. We also used larger cable ties to attach the vertical plane to the z axis and let it rotate freely above the xy plane. However, the foamboard is not very strong structurally, so we found that we had to reinforce all the edges of the foamboard with clear tape before starting. On the vertical edge, the one parallel to the z axis, we used a triple layer of clear tape; otherwise the cable ties tended to pull through the
foamboard.
Above: The reinforcement of the edges of the foamboard using clear shipping tape.
After reinforcing the edges, we used a blade cutter to make three vertical slits along the vertical edge; the slits are for the cable ties. We made the slits approximately approx. 0.75 cm from edge, and 0.5 cm long. We then inserted one of the longer cable ties in each of the three holes, and fastened them very loosely.
Above left: Inserting cable ties through each of the the three slits.
Above right: Fastening the cable tie very loosely.
Now comes the most difficult part of the construction! The three cable ties are slipped over the vertical (z) axis so that the vertical plane is hanging off the axis. The ideal situation is for the vertical plane to swing freely, like a door on a hinge, over the xy plane. In order to achieve this, however, it is necessary to tighten the cable ties very precisely. They need to be tight enough so that the plane doesn’t sag, but loose enough so that the plane can rotate, and also be pulled on-and-off in order to unassembled the CARDIS. This takes a while to get right; we went through a lot of cable ties by tightening them too much and then having to cut them off. Once you are happy, cut off the remaining end of the cable tie and then put a drop of glue on the sharp spot so that students will not hurt themselves.
Above left and right: tightening the cable ties so that the vertical plane can swing freely but
accurately.
Above left and right: The finished vertical plane.
Once you are happy with your vertical plane and the way it hangs, mark the positions of the gridlines, making sure they line up with the tickmarks on the axes (pipes). Use a ruler and a permanent marker to draw in the gridlines and angle lines.
Adding texture to the grid lines (both xy plane and vertical plane)
As discussed above under “Adding tickmarks to the grid”, it was necessary to add texture to the grid lines in order to make them tactile. After trying several methods, our favorite was to glue down cord of two very different textures, using one texture for the grid lines and a second texture for the angle lines. Using only one type of cord resulted in confusion near the origin. We used the white craft glue as it dried thin and clear, although it took a long time to dry. We found it most efficient to cut the pieces of cord to the right length, lay down a long bead of glue along the line, and then set the cord on top of the glue. We would lay down all the horizontal lines, wait for it to dry, lay down all the vertical lines, wait for it to dry, lay down all the angle lines, and then wait once more.
Above: Laying down and gluing the cord. However, see the photo below; in this version we forgot to leave space at the ends for the Braille labels.
Above: We recovered from our error by peeling off the ends of the cord and snipping it. One thing that we forgot to do was to leave space at the edges of the vertical plane for the Braille labels, so we peeled and cut off the ends as shown above. This was not an issue on the xy plane (foam mat), as the foam mat was much thicker, and we could put the angle labels on the side of the mat.
Labeling the axes
Before labeling the axes x, y, and z, stop to consider whether or not you have created a righthanded coordinate system. There is a difference between right-handed and left-handed systems. As illustrated below, use your right hand to create three perpendicular axes using your thumb and first two fingers. Your thumb is the x-axis. Your first finger is the y-axis. There are now TWO different directions that the z-axis could go: up or down. One way is right-handed, the other way is left handed. Using your right hand, your middle finger is the z-axis. Try doing this with your left hand, and you will find that you get the z-axis pointing in the other direction! Above: An example of a right-handed coordinate system. Using the right hand, the thumb is the x-axis, the first finger is the y-axis, and the middle finger is the z-axis. We used a Braille labeler to label the axes (pipes), the names of the angles (theta and phi), and the numerical values of the angles on both the xy plane and the vertical plane. We did not label the values of the xy tickmarks.
Above: Example of labeling the angles.
Hints on usage
If you are only doing area and volume, you will not need the vertical plane, nor the angle markings. These hints are for the most difficult usage, which is the conversion between Cartesian and spherical coordinates. As discussed above, the R vector is represented by the knotted cord. In order to suspend the R vector in the three-dimensional space, we pinned the cord to the vertical plane. We found that map pins (shown below) worked better than either thumb tacks or push pins. To set up the R vector for the conversion, we chose the length of the R vector by choosing a particular knot on the string. Pin the tip of the R vector where you want it. The uncertainties will be minimized by lining up your R vector with even angle lines. (See illustration below.) In our tests, it was only possible to measure the angle tactilely to the nearest five degrees, while with 5 cm tickmarks it was possible to measure to the nearest quarter or third of a tick.
Drop the remaining cord to the xy plane, and pin it a second time on the xy plane. This should keep the plane from shifting around too much during measurement. We have made some sample measurements and converted successfully between Cartesian and spherical coordinate systems. For a description of those measurements, please see the document entitled “Tactile 3D Grid: Coordinates and Relative Dimension in Space (CARDIS).”
For that document as well as suggested activities, please see the website http://astrosense.astro4dev.org/.
Above left: The CARDIS set up for the transformations between Cartesian and spherical coordinates.
Above right: The typical graphical demonstration seen in textbooks.
Acknowledgements
We are grateful for the suggestions of Stephen Levine, Nicholas Erasmus, Willie Koorts, and Amanda Sickafoose. The IAU Office of Astronomy for Development were excellent hosts. KDE was supported by a Fulbright Specialist grant.
Questions and Suggestions:
We welcome feedback and suggestions; please email kathy.eastwood@gmail.com.